Skip to main content
Toolbar items
Back to site
Manage
Administration menu
Tools
FlexSlider Examples
FlexSlider examples menu
Anonymous
User account actions
Log in
Contact us
Support us
My Account
Created with Sketch.
Toggle navigation
Main navigation
Home
News & Press
Latest News
Research Highlights
Media Enquiries
Journals
Monthly Notices of the RAS (MNRAS)
Geophysical Journal International (GJI)
RAS Techniques & Instruments (RASTI)
Editorial Boards & Team
Editorial Policies
Advancing Astronomy & Geophysics
Events
RAS Meetings
External Meetings
Public Lectures & Events
Friends of the RAS Events
Past Events
Library
Visiting & Using the Library
Library Services
Archives
Other Collections
Help with your Research
Treasures from the Library & Archives
Obituaries
Awards & Grants
Fellowships
Awards, Medals and Prizes
Grants for Studies in Astronomy and Geophysics
Education & Outreach
Podcast
Education
Outreach
Careers
RAS200
Resources
Early Careers
About the RAS
Bicentenary
Burlington House
Bye-laws
Committees
Contacts
Council
Diversity
Sustainability
A&G
Latest A&G Articles
Contact A&G Editor
Membership
Fellows Membership
Friends of the RAS
Public Policy
Science Policy
Impact & Industry
Community & Demographics
Consultative Forums
Timeline
RAStroPhoto
×
Home
News & Press
Latest News
Research Highlights
Media Enquiries
Journals
Monthly Notices of the RAS (MNRAS)
Geophysical Journal International (GJI)
RAS Techniques & Instruments (RASTI)
Editorial Boards & Team
Editorial Policies
Advancing Astronomy & Geophysics
Events
RAS Meetings
External Meetings
Public Lectures & Events
Friends of the RAS Events
Past Events
Library
Visiting & Using the Library
Library Services
Archives
Other Collections
Help with your Research
Treasures from the Library & Archives
Obituaries
Awards & Grants
Fellowships
Awards, Medals and Prizes
Grants for Studies in Astronomy and Geophysics
Education & Outreach
Podcast
Education
Outreach
Careers
RAS200
Resources
Early Careers
About the RAS
Bicentenary
Burlington House
Bye-laws
Committees
Contacts
Council
Diversity
Sustainability
A&G
Membership
Fellows Membership
Friends of the RAS
Public Policy
Science Policy
Impact & Industry
Community & Demographics
Consultative Forums
Timeline
RAStroPhoto
×
Apply
3iallprofiles.png
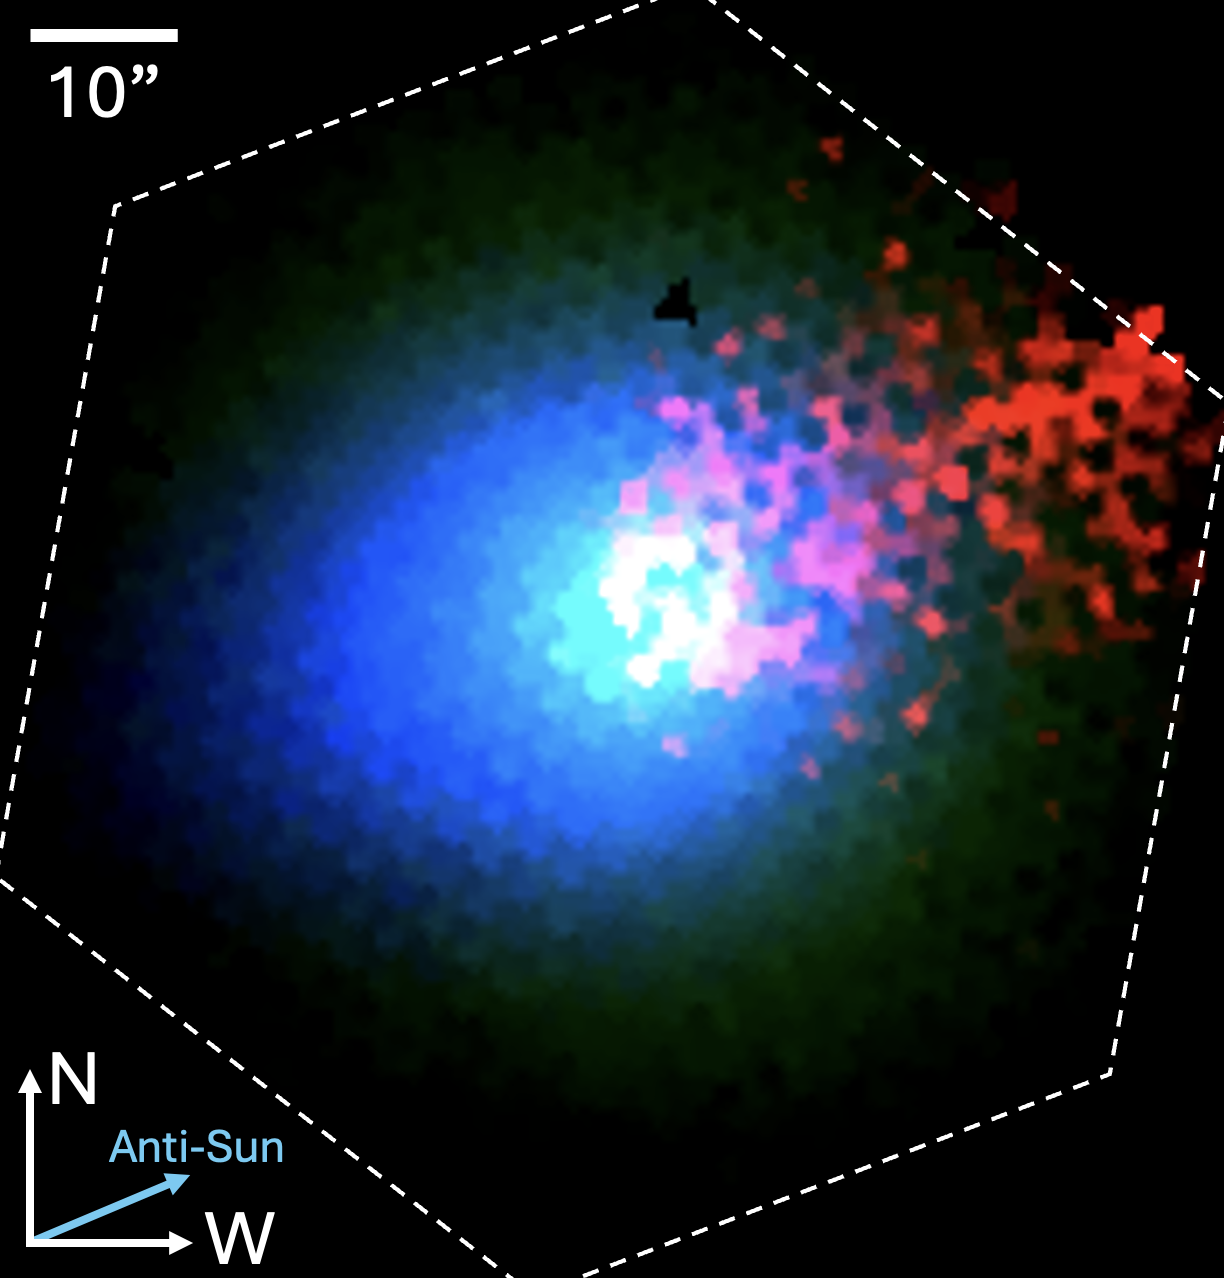
This figure illustrates the different distributions of dust (blue), gas (green) and ions (red) in 3I/Atlas.
Lea Ferellec
Licence type
Attribution (CC BY 4.0)