Figure 2
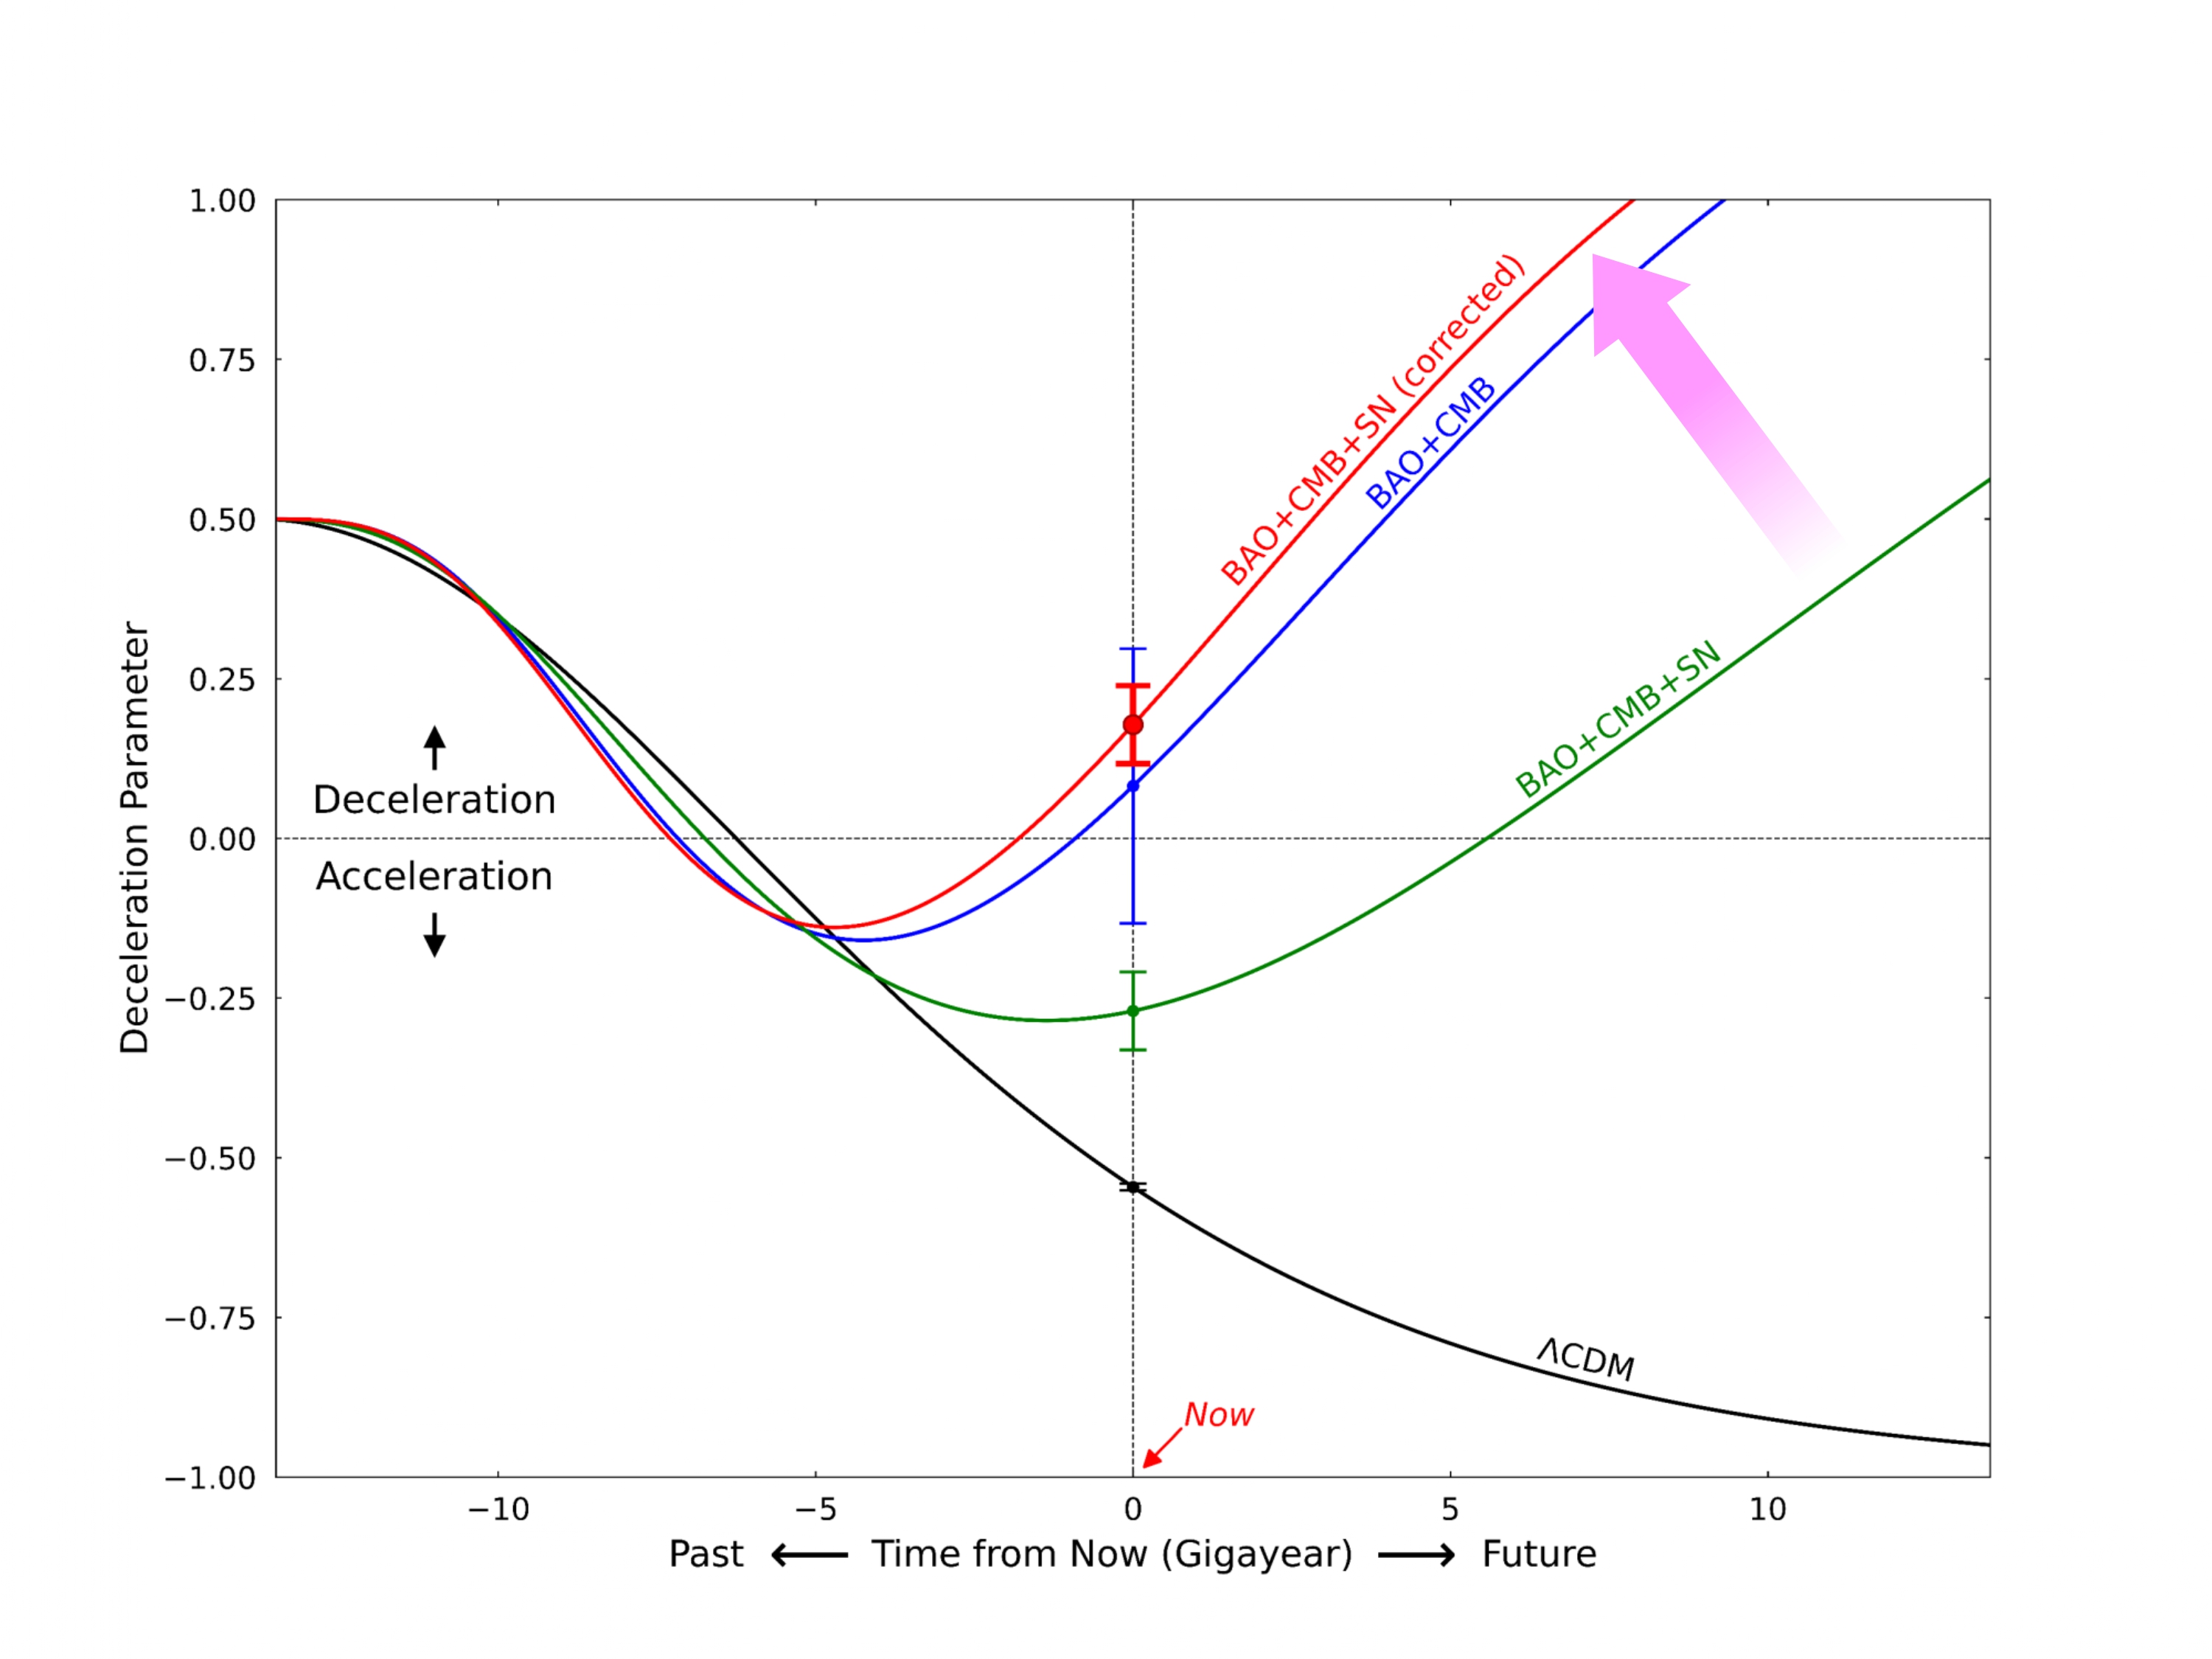
This diagram shows how the universe appears to be in a state of decelerated expansion (red line). The dotted vertical line marks the present epoch, while the black line shows the ΛCDM prediction. The green and red lines represent the new study’s model before (green) and after (red) age-bias correction, consistent with baryonic acoustic oscillations and cosmic microwave background data (blue line).
Son et al.
Licence type