Critical height
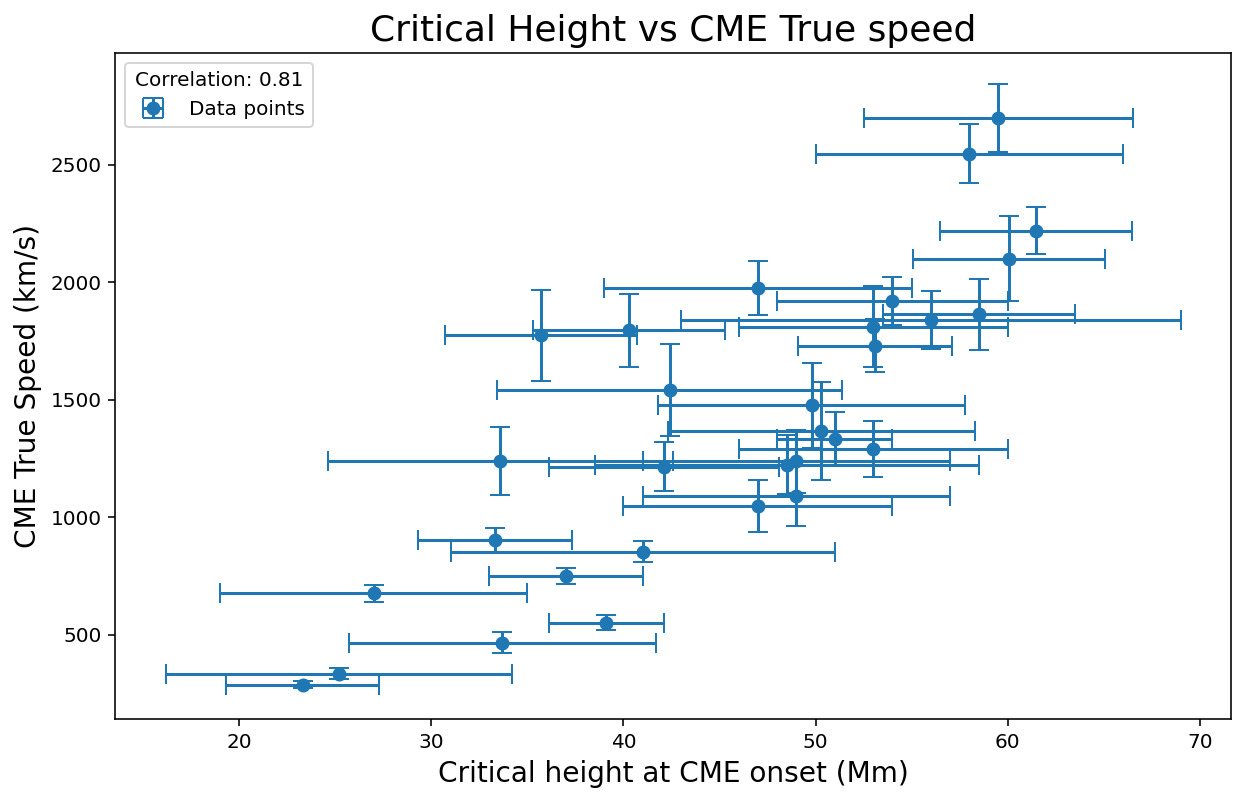
Explanation: Using the above plot for prediction requires a robust statistical or machine learning model that accounts for uncertainties and other influencing factors beyond just the critical height. This plot alone does not provide a complete predictive model for new active regions. The critical height and onset conditions might change rapidly over time, and new active regions could evolve differently compared to historical data. While the plot provides valuable insights and a strong correlation between critical height and CME speed, predicting CME speeds in new active regions requires caution. A more comprehensive model incorporating additional parameters and uncertainties is necessary for reliable predictions. Therefore, the plot can be a useful component in a predictive framework, but it should not be the sole basis for predicting CME speeds in new active regions.