IMG_4223.jpg
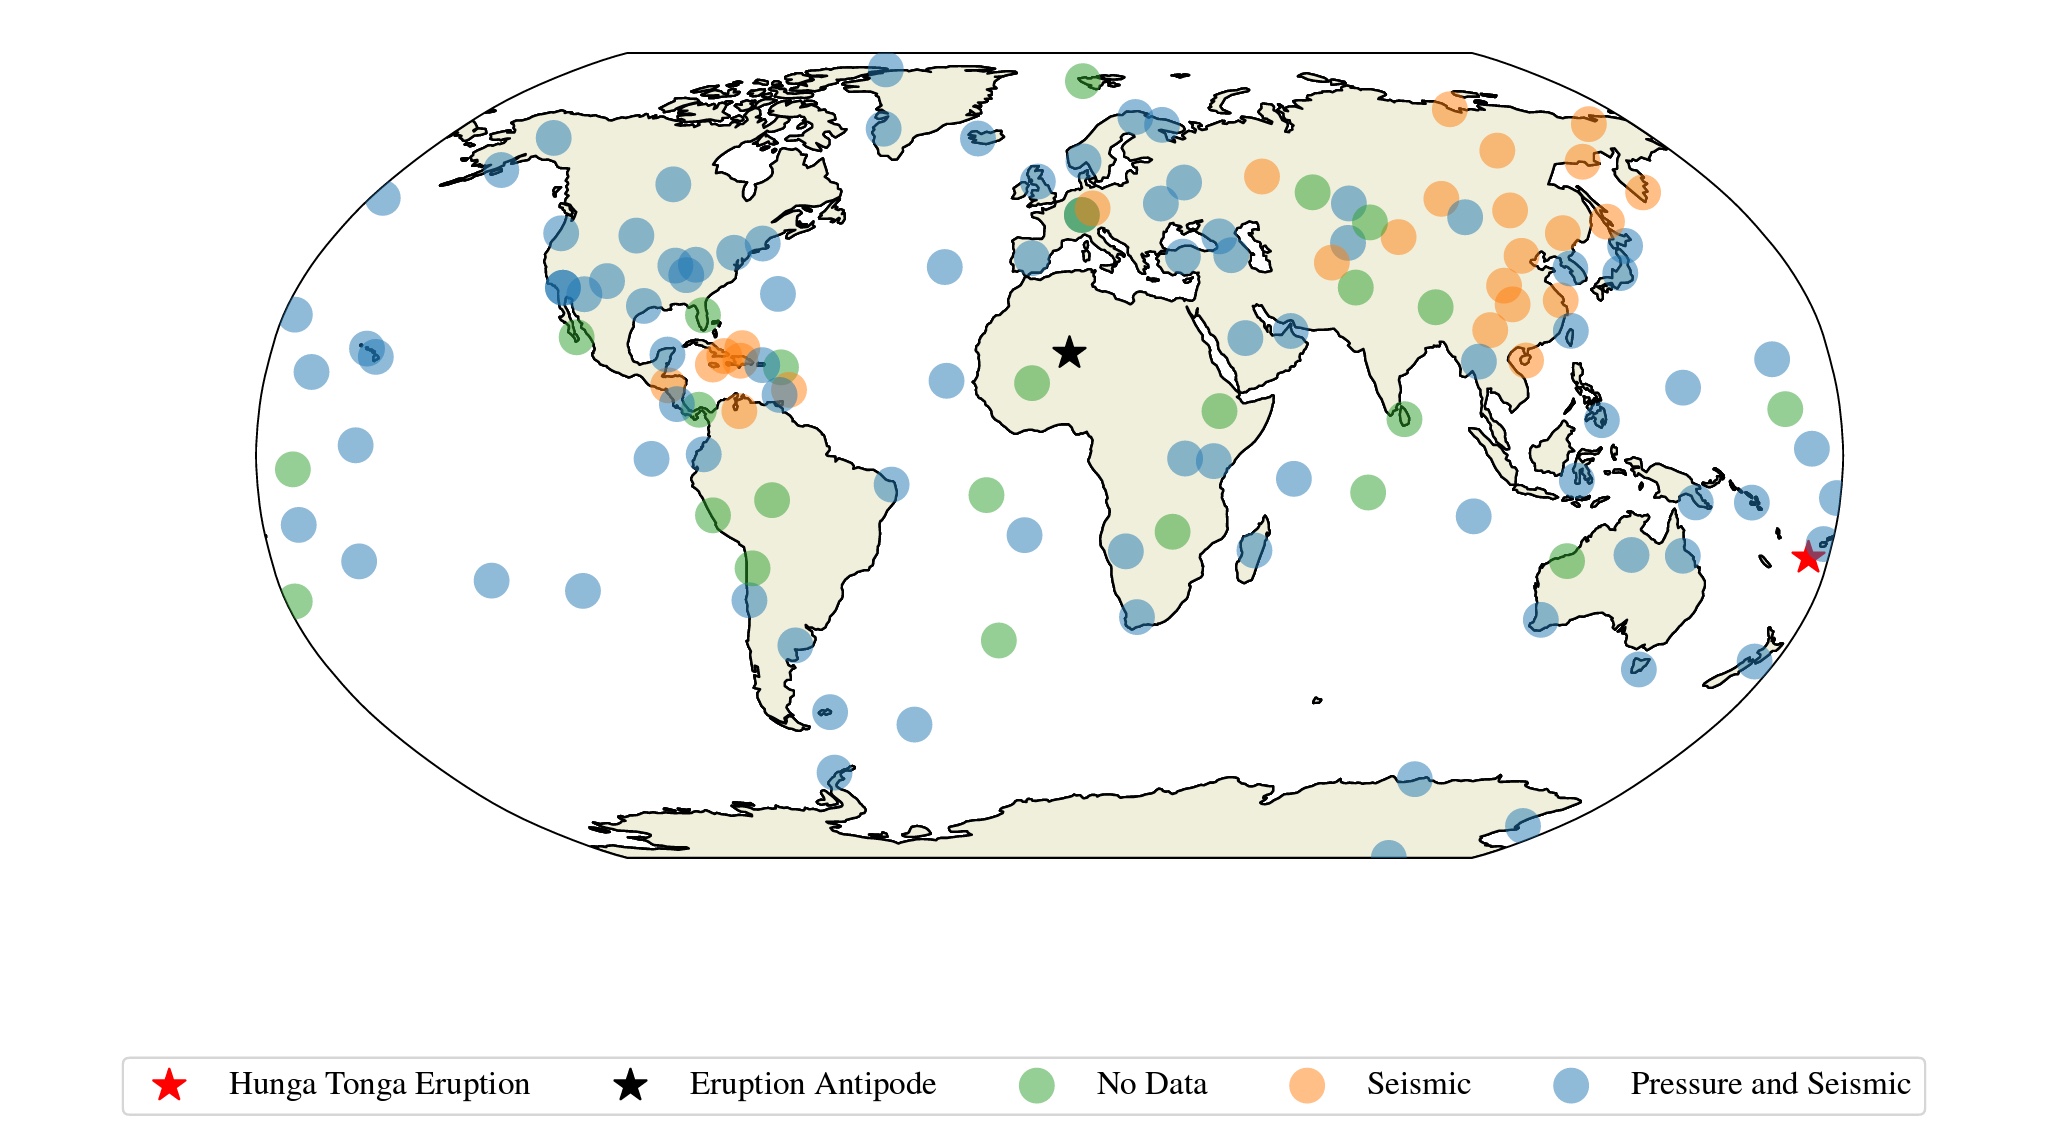
Figure 1 from the paper, reproduced here, highlights stations from the network which did not provide data (for example, the station was down) in green, stations with only a seismometer in orange and stations with both a seismometer and microbarograph in blue. The location of the Hunga Tonga eruption is marked by a red star, and the antipode is marked by a black star.
Ringler et al.